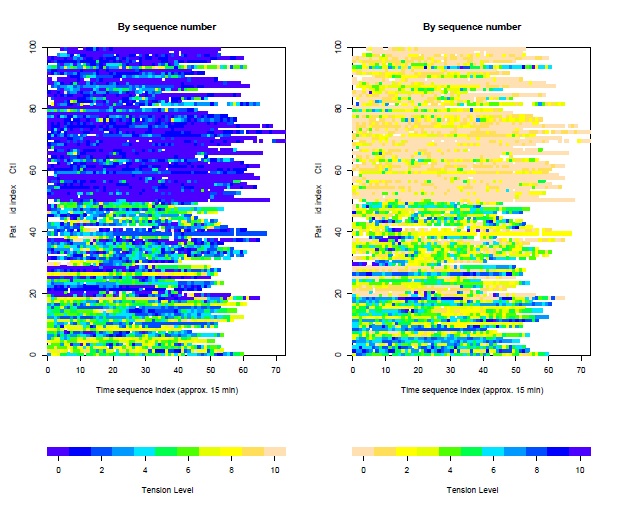
To plot three-dimensional data sets as heats maps (for an example see Ebner-Priemer & Sawitzki, 2007; European Journal of Psychological Assessment; see Figure below) you can use the following software, which is programmed in R by Gunther Sawitzki and open source (http://bertin.r-forge.r-project.org/).